
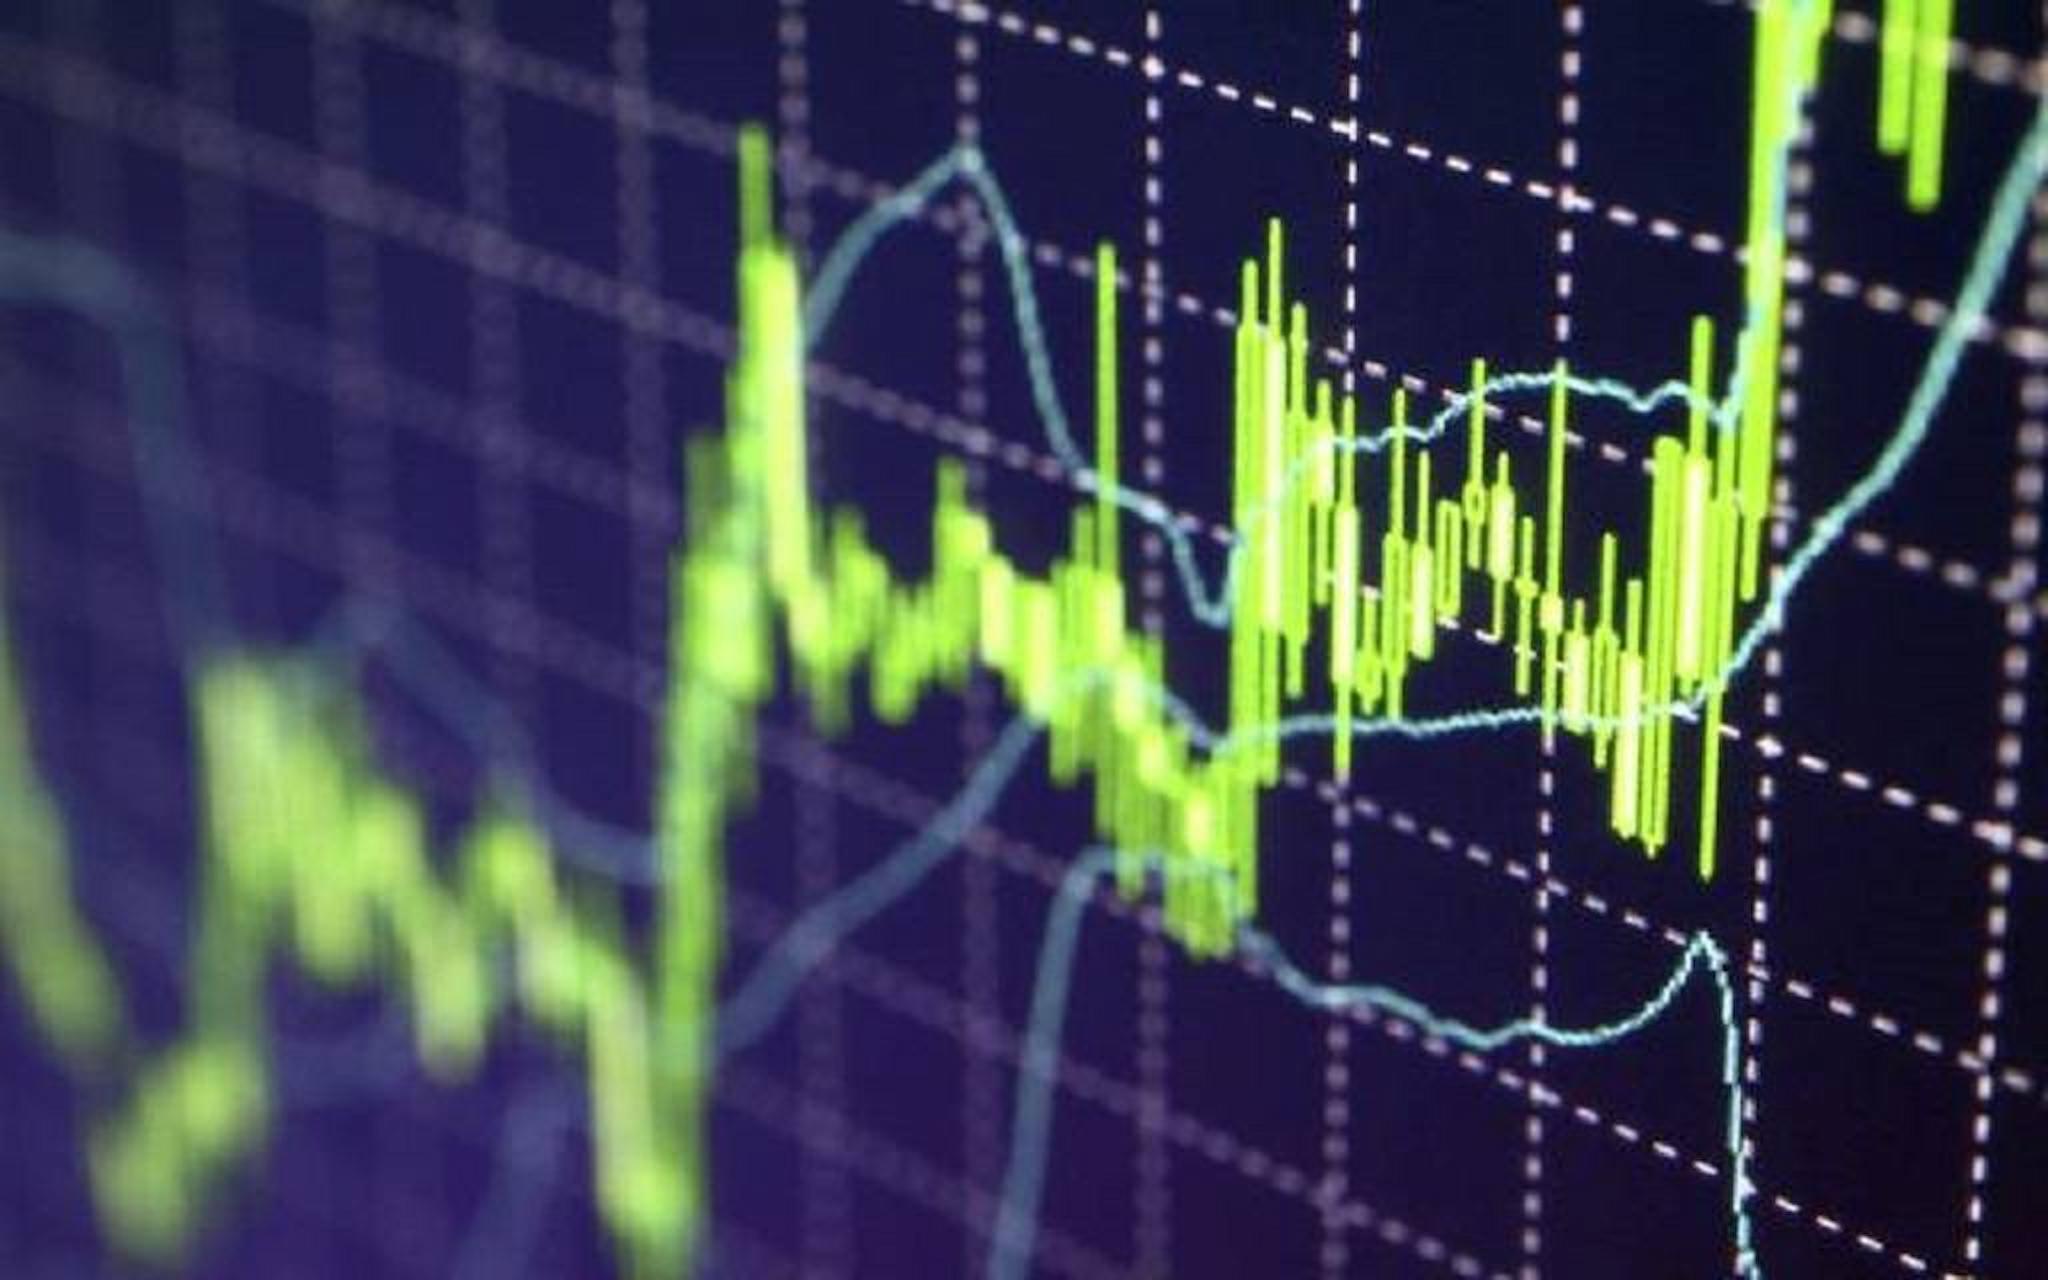
The decisions you make in forex trading are probably the most crucial ones that you will ever have in your entire life. It is a thoroughly complex game that requires lots of time and psychological endurance. Traders must also have vast knowledge about the market, the price prediction through the help of candlestick patterns. In an FX trading platform, there are a huge variety of indicators to choose from. These indicators will help you provide clearer exit and entry points.
But despite all these magnificent indicators, everything is still up to the power of the trader to interpret the candlestick patterns. Because of that, it is best to know and understand precisely the meaning of these patterns because they will help you assist in figuring out which is the best time to sell high and buy low in the Forex market.
The Hanging Man and The Hammer
The most easily recognized candlestick patterns are the hammer and the hanging man. Although very basic, they are very useful if you decide to trade when the market is going to reverse. That is the time when it becomes one of the categories for the one-candlestick reversal patterns. The hanging man appears to be the bearish pattern which is mostly seen on top of the uptrend and the bullish pattern is located at the bottom and is mostly associated with the decline in the price. These patterns can be traded on any time frame but not higher than 15M.
If you want to succeed in Forex, you need to have the ability to recognize these patterns because they provide you with a good hint on the probable top and the probable bottom, where traders base their entry and exit points.
Shooting Star and Inverted Hammer Point
Another candlestick pattern commonly seen in Forex is the shooting star and the inverted hammer. They appear as a hanging man and hammer that was turned upside down which acts as the reversal patterns that shows at the probable finale whenever there is a strong trending movement. Both of these candlestick patterns are created whenever the price of a currency pair opens up slightly just above the price where it was close on the previous day. One thing to remember is that shooting star patterns can only be traded on trending markets particularly during powerful rallies or when reaching the top of the congestion zone.
Three Black Crows
This candlestick pattern creates a bearish reversal pattern that appears like three consecutive bearish candles taking the shape when they are on top of the powerful rally. You can easily identify these bearish patterns whenever you see this in a time frame. But you must also take note that these patterns work best when they are higher than 30M.
These are just three patterns most commonly seen in the candlestick pattern. To be able to really know when to enter and exit the market, it is best to understand each one of them and so you will know the right points in forex Trading.